How to Use Different Types of Reports in Business Manager
If you are using Business Manager to manage your business operations, you might be wondering how to use the various types of reports available in the software. Reports are useful tools to monitor your business performance, track your sales and purchases, analyze your taxes, and manage your contacts and inventory. In this blog post, we will explain how to view and use four types of reports in Business Manager: Purchase & Sale Report, Tax Reports, Contacts Report, and Stock Report.
To view any report, click on Reports in the main menu and select the report you want to view from the drop-down list. Some reports come with filter options to help you customize the data according to your needs. For example, you can filter by date range, contact, location, category, or product.
Purchase & Sale Report
This report shows the total purchase and sale transactions for a given period. You can see the purchase amount, purchase amount including tax, purchase due amount, sale amount, sale amount including tax, and sale due amount. This report helps you to compare your income and expenses and see your profit margin.
Tax Reports
This report shows the input and output taxes for a given period. You can see the tax name, tax rate, taxable amount, and the tax amount for each tax type. This report helps you to calculate your tax liability and prepare your tax returns.
Contacts Report (Customers & Suppliers Report)
This report shows the details of purchase and sale transactions with all contacts (customers and suppliers) for a given period. You can see the contact name, contact type, opening balance, purchase amount, sale amount, the payment received, payment paid, and closing balance for each contact. This report helps you to manage your accounts receivable and accounts payable and see your cash flow.
Stock Report
This report shows the stock details for all products for a given period. You can see the product name, SKU, category, location, opening stock quantity, purchase quantity, sale quantity, stock adjustment quantity, transfer quantity, waste quantity, and closing stock quantity for each product. This report helps you to track your inventory levels and see your stock turnover.
For variable products (products with different attributes such as size or color), you can click on the green plus button before the SKU column to get details of stock reports for each product variation.
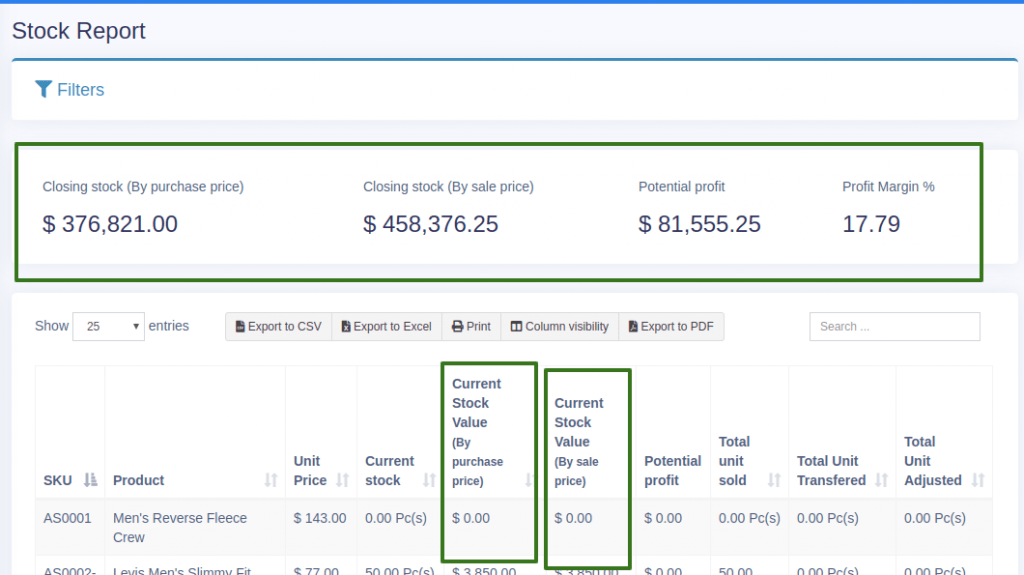
Stock value by purchase and sales price
In the stock report, you can also get information about the current stock value based on their purchase price and value based on their selling price. This helps you to see your potential profit or loss from selling your inventory.

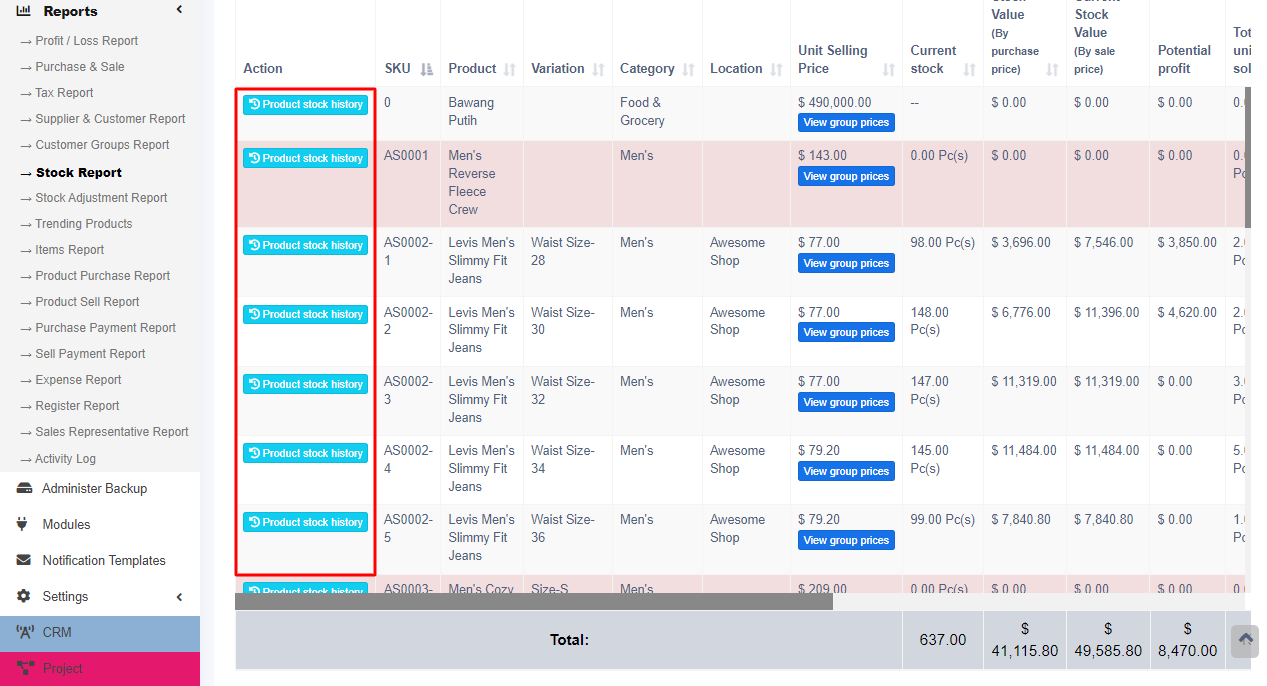
Tracking product stock report with date #
To check the product stock report datewise, use the ‘product stock history‘ link in the stock report.
#
Trending Products Report #
This report helps you to determine the demand for the products. Here are some features of this report:
– You can apply different filters to filter the product. This allows you to narrow down your analysis and focus on specific aspects of the product demand.
– Select a Business Location to view trends for a particular business location. This helps you to compare the demand across different regions and markets.
– Select Product Category, Sub-Category, Brands, Units, and Date Range to filter them. This helps you to segment the product demand by various criteria and see how they change over time.
– Set “No. of products” to view the top of that amount of products. Using this you can view the Top 5, Top 10, or any number of top products. This helps you to identify the most popular and profitable products in your portfolio.
Expense Report #
An expense report is a useful tool for managing your business finances. It allows you to track and compare the costs of different locations and categories, such as rent, utilities, travel, and supplies. By using the expense report, you can identify areas where you can save money, optimize your budget, and improve your profitability.
Register Report #
This feature allows you to view details of all registers and filter registers based on User and/or Status (Open or Closed). You can access this feature from the main menu by selecting the Register option. You can then choose to view all registers or apply filters to narrow down your results. You can also sort the registers by date, name, or amount. This feature helps you to keep track of your registers and their status.
Sales Representative Report #
- To view the sales and expenses details of the sales representative, you can use the following steps:
- Select the Sales Representative Report and choose the sales representative from the User drop-down list.
- Select the Business Location tab and choose the location from the drop-down list.
- Select the Date Range tab and choose the start and end dates from the calendar.
- Click on the View Report button to generate the report.
-
The report will show you the sales and expenses details of the selected sales representative for the chosen location and date range. You can export the report as a PDF or Excel file by clicking on the Export button.


